案例分析2
为了深入分析研究中国城镇居民的生活费支出与可支配收入的具体数量关系,收集了中国城镇居民月人均可支配收入(SR)和生活费支出(ZC)1992年至1998年各月度数据序列(见表10.3)。
表10.3 城镇居民月人均生活费支出和可支配收入序列
| 序列 |
月份 |
1992 |
1993 |
1994 |
1995 |
1996 |
1997 |
1998 |
| 可 支配 收入 Sr |
1 |
151.83 |
265.93 |
273.98 |
370.00 |
438.37 |
521.01 |
643.40 |
| 2 |
159.86 |
196.96 |
318.81 |
385.21 |
561.29 |
721.01 |
778.62 |
| 3 |
124.00 |
200.19 |
236.45 |
308.62 |
396.82 |
482.38 |
537.16 |
| 4 |
124.88 |
199.48 |
248.00 |
320.33 |
405.27 |
492.96 |
545.79 |
| 5 |
127.75 |
200.75 |
261.16 |
327.94 |
410.06 |
499.90 |
567.99 |
| 6 |
134.48 |
208.50 |
273.45 |
338.53 |
415.38 |
508.81 |
555.79 |
| 7 |
145.05 |
218.82 |
278.10 |
361.09 |
434.70 |
516.24 |
570.23 |
| 8 |
138.31 |
209.07 |
277.45 |
356.30 |
418.21 |
509.98 |
564.38 |
| 9 |
144.25 |
223.17 |
292.71 |
371.32 |
442.30 |
538.46 |
576.36 |
| 10 |
143.86 |
226.51 |
289.36 |
378.72 |
440.81 |
537.09 |
599.40 |
| 11 |
149.12 |
226.62 |
296.50 |
383.58 |
449.03 |
534.12 |
577.40 |
| 12 |
139.93 |
210.32 |
277.60 |
427.78 |
449.17 |
511.22 |
606.14 |
| 生活 费支 出 Zc |
1 |
139.47 |
221.74 |
234.28 |
307.10 |
373.58 |
419.39 |
585.70 |
| 2 |
168.07 |
186.49 |
272.09 |
353.55 |
471.77 |
528.09 |
598.82 |
| 3 |
110.47 |
185.92 |
202.88 |
263.37 |
350.36 |
390.04 |
417.27 |
| 4 |
113.22 |
185.26 |
227.89 |
281.22 |
352.15 |
405.63 |
455.60 |
| 5 |
115.82 |
187.62 |
235.70 |
299.73 |
369.57 |
426.81 |
466.20 |
| 6 |
118.20 |
12.11 |
237.89 |
308.18 |
370.41 |
422.00 |
455.19 |
| 7 |
118.03 |
186.75 |
239.71 |
315.87 |
376.90 |
428.70 |
458.57 |
| 8 |
124.45 |
187.07 |
252.52 |
331.88 |
387.44 |
459.29 |
475.40 |
| 9 |
147.70 |
219.23 |
286.75 |
385.99 |
454.93 |
517.06 |
591.41 |
| 10 |
135.14 |
212.80 |
270.00 |
355.92 |
403.77 |
463.98 |
494.57 |
| 11 |
135.20 |
205.22 |
274.37 |
355.11 |
410.10 |
422.96 |
496.69 |
| 12 |
128.03 |
192.64 |
250.01 |
386.08 |
400.48 |
460.92 |
516.16 |
数据来源:转摘自易丹辉《数据分析与Eviews的应用》,中国统计出版社2002,P141。
由于所用数据为时间序列数据,需要检验其平稳性,并用EG两步法考察它们之间是否存在协整关系。
根据协整关系的检验方法,首先回答人均可支配收入(SR)和生活费支出(ZC)序列是否为非平稳序列,即考察其单整阶数。
在Eviews中具体操作过程如下:
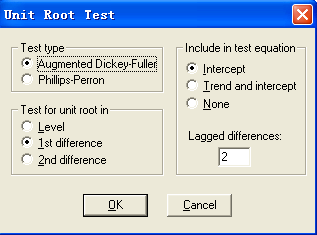
在Eviews中建立文档,录入人均可支配收入(SR)和生活费支出(ZC)序列的数据。双击人均可支配收入(SR)序列,出现工作文件窗口,在其左上方点击Eview键出现下拉菜单,点击Unit Root Test,出现对话框(图10.2),选择带截距项(intercept),滞后差分项(Lagged differences)选2阶,点击OK,得到估计结果,见表10.4。
从检验结果看,在1%、5%、10%三个显著性水平下,单位根检验的Mackinnon临界值分别为-3.5121、-2.8972、-2.5855, t检验统计量值-0.862611大于相应临界值,从而不能拒绝 ,表明人均可支配收入(SR)序列存在单位根,是非平稳序列。

图10.2 单位根检验回归方程设定(水平变量)
表10.4 SR序列的ADF检验结果为
| ADF Test Statistic |
-0.862611 |
1% Critical Value* |
-3.5121 |
| |
|
5% Critical Value |
-2.8972 |
| |
|
10% Critical Value |
-2.5855 |
| *MacKinnon critical values for rejection of hypothesis of a unit root. |
| |
|
|
|
|
| Augmented Dickey-Fuller Test Equation |
| Dependent Variable: D(SR) |
| Method: Least Squares |
| Date: 06/08/05 Time: 10:31 |
| Sample(adjusted): 4 84 |
| Included observations: 81 after adjusting endpoints |
| Variable |
Coefficient |
Std. Error |
t-Statistic |
Prob. |
| SR(-1) |
-0.034595 |
0.040105 |
-0.862611 |
0.3910 |
| D(SR(-1)) |
-0.409380 |
0.108905 |
-3.759060 |
0.0003 |
| D(SR(-2)) |
-0.336998 |
0.107273 |
-3.141502 |
0.0024 |
| C |
22.63601 |
15.75919 |
1.436369 |
0.1549 |
| R-squared |
0.221103 |
Mean dependent var |
5.952346 |
| Adjusted R-squared |
0.190756 |
S.D. dependent var |
60.73081 |
| S.E. of regression |
54.63220 |
Akaike info criterion |
10.88725 |
| Sum squared resid |
229820.1 |
Schwarz criterion |
11.00549 |
| Log likelihood |
-436.9334 |
F-statistic |
7.285920 |
| Durbin-Watson stat |
2.151282 |
Prob(F-statistic) |
0.000230 |
为了得到人均可支配收入(SR)序列的单整阶数,在单位根检验(Unit Root Test)对话框(图10.3)中,指定对一阶差分序列作单位根检验,选择带截距项(intercept),滞后差分项(Lagged differences)选2阶,点击OK,得到估计结果,见表10.5。

图10.3 单位根检验回归方程设定(一阶差分序列)
表10.5 SR差分序列的ADF检验结果
| ADF Test Statistic |
-8.374339 |
1% Critical Value* |
-3.5132 |
| |
|
5% Critical Value |
-2.8976 |
| |
|
10% Critical Value |
-2.5858 |
| *MacKinnon critical values for rejection of hypothesis of a unit root. |
| |
|
|
|
|
| Augmented Dickey-Fuller Test Equation |
| Dependent Variable: D(SR,2) |
| Method: Least Squares |
| Date: 06/08/05 Time: 10:40 |
| Sample(adjusted): 5 84 |
| Included observations: 80 after adjusting endpoints |
| Variable |
Coefficient |
Std. Error |
t-Statistic |
Prob. |
| D(SR(-1)) |
-2.188331 |
0.261314 |
-8.374339 |
0.0000 |
| D(SR(-1),2) |
0.674099 |
0.190534 |
3.537949 |
0.0007 |
| D(SR(-2),2) |
0.225326 |
0.111513 |
2.020631 |
0.0468 |
| C |
12.59155 |
6.180708 |
2.037234 |
0.0451 |
| R-squared |
0.718058 |
Mean dependent var |
0.348250 |
| Adjusted R-squared |
0.706929 |
S.D. dependent var |
99.32732 |
| S.E. of regression |
53.77189 |
Akaike info criterion |
10.85609 |
| Sum squared resid |
219747.6 |
Schwarz criterion |
10.97519 |
| Log likelihood |
-430.2434 |
F-statistic |
64.51970 |
| Durbin-Watson stat |
2.095341 |
Prob(F-statistic) |
0.000000 |
从检验结果看,在1%、5%、10%三个显著性水平下,单位根检验的Mackinnon临界值分别为-3.5121、-2.8972、-2.5855, t检验统计量值为-8.374339,小于相应临界值,从而拒绝 ,表明人均可支配收入(SR)的差分序列不存在单位根,是平稳序列。即SR序列是一阶单整的,SR~I(1)。
采用同样方法,可检验得到ZC序列也是一阶单整的,即ZC~I(1)。
为了分析可支配收入(SR)和生活费支出(ZC)之间是否存在协整关系,我们先作两变量之间的回归,然后检验回归残差的平稳性。
以生活费支出(ZC)为被解释变量,可支配收入(SR)为解释变量,用OLS回归方法估计回归模型,结果见表10.6。
表10.6 ZC对SR的OLS回归结果
| Dependent Variable: ZC |
| Method: Least Squares |
| Date: 06/08/05 Time: 10:58 |
| Sample: 1 84 |
| Included observations: 84 |
| Variable |
Coefficient |
Std. Error |
t-Statistic |
Prob. |
| C |
18.98866 |
8.674160 |
2.189107 |
0.0314 |
| SR |
0.819677 |
0.021777 |
37.63950 |
0.0000 |
| R-squared |
0.945287 |
Mean dependent var |
318.3649 |
| Adjusted R-squared |
0.944620 |
S.D. dependent var |
134.7917 |
| S.E. of regression |
31.72051 |
Akaike info criterion |
9.775326 |
| Sum squared resid |
82507.66 |
Schwarz criterion |
9.833202 |
| Log likelihood |
-408.5637 |
F-statistic |
1416.732 |
| Durbin-Watson stat |
1.609062 |
Prob(F-statistic) |
0.000000 |
估计的回归模型为:
 (10.15)
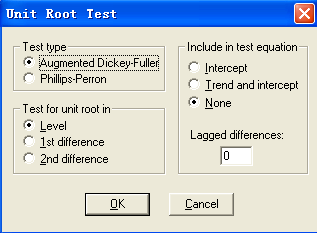
为了检验回归残差的平稳性,在工作文档窗口中,点击Genr功能键,命令ut=Resid,将上述OLS回归得到的残差序列命名为新序列ut,然后双击ut序列,对ut序列进行单位根检验。由于残差序列的均值为0,所以选择无截距项、无趋势项的DF检验,模型设定见图10.4,估计结果见表10.7。

图10.4 回归残差序列单位根检验的模型设定
表10.7
| ADF Test Statistic |
-7.430111 |
1% Critical Value* |
-2.5909 |
| |
|
5% Critical Value |
-1.9441 |
| |
|
10% Critical Value |
-1.6178 |
| *MacKinnon critical values for rejection of hypothesis of a unit root. |
| |
|
|
|
|
| Augmented Dickey-Fuller Test Equation |
| Dependent Variable: D(UT) |
| Method: Least Squares |
| Date: 06/08/05 Time: 11:21 |
| Sample(adjusted): 2 84 |
| Included observations: 83 after adjusting endpoints |
| Variable |
Coefficient |
Std. Error |
t-Statistic |
Prob. |
| UT(-1) |
-0.804627 |
0.108293 |
-7.430111 |
0.0000 |
| R-squared |
0.402360 |
Mean dependent var |
0.051836 |
| Adjusted R-squared |
0.402360 |
S.D. dependent var |
40.23706 |
| S.E. of regression |
31.10614 |
Akaike info criterion |
9.724662 |
| Sum squared resid |
79342.53 |
Schwarz criterion |
9.753805 |
| Log likelihood |
-402.5735 |
Durbin-Watson stat |
1.973914 |
在5%的显著性水平下, t检验统计量值为-7.430111,大于相应临界值,从而拒绝 ,表明残差序列不存在单位根,是平稳序列,说明可支配收入(SR)和生活费支出(ZC)之间存在协整关系。
可支配收入(SR)和生活费支出(ZC)之间存在协整,表明两者之间有长期均衡关系。但从短期来看,可能会出现失衡,为了增强模型的精度,可以把协整回归(10.15)式中的误差项 看作均衡误差,通过建立误差修正模型把生活费支出的短期行为与长期变化联系起来。误差修正模型的结构如下:
 (10.16)
在Eviews中,点击Genr功能键,生成可支配收入(SR)和生活费支出(ZC)的差分序列:


然后以DZCt作为被解释变量,以DSRt和 作为解释变量,估计回归模型(10.16),结果见表10.8。
表10.8
| Dependent Variable: DZC |
| Method: Least Squares |
| Date: 07/03/05 Time: 21:30 |
| Sample(adjusted): 2 84 |
| Included observations: 83 after adjusting endpoints |
| Variable |
Coefficient |
Std. Error |
t-Statistic |
Prob. |
| C |
0.326424 |
3.456724 |
0.094432 |
0.9250 |
| DSR |
0.768942 |
0.059678 |
12.88490 |
0.0000 |
| UT(-1) |
-0.779148 |
0.113186 |
-6.883800 |
0.0000 |
| R-squared |
0.691102 |
Mean dependent var |
4.538434 |
| Adjusted R-squared |
0.683380 |
S.D. dependent var |
55.71666 |
| S.E. of regression |
31.35122 |
Akaike info criterion |
9.763859 |
| Sum squared resid |
78631.93 |
Schwarz criterion |
9.851287 |
| Log likelihood |
-402.2001 |
F-statistic |
89.49261 |
| Durbin-Watson stat |
1.996276 |
Prob(F-statistic) |
0.000000 |
最终得到误差修正模型的估计结果:

上述估计结果表明,城镇居民月人均生活费支出的变化不仅取决于可支配收入的变化,而且还取决于上一期生活费支出对均衡水平的偏离,误差项ut的估计系数-0.7791体现了对偏离的修正,上一期偏离越远,本期修正的量就越大,即系统存在误差修正机制。